

ALPHABrotherHai
Ride with the trend, accompany with profit.
ALPHABrotherHai
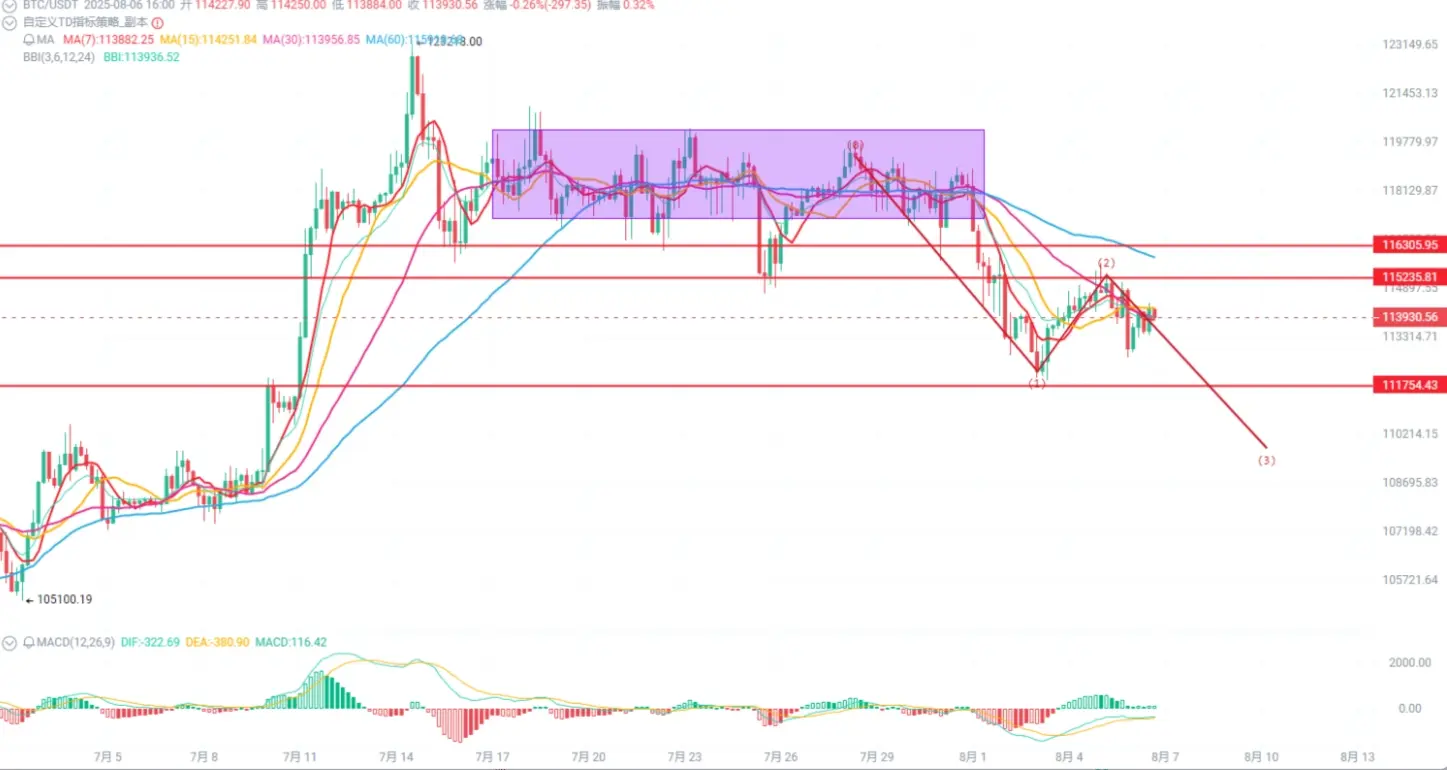
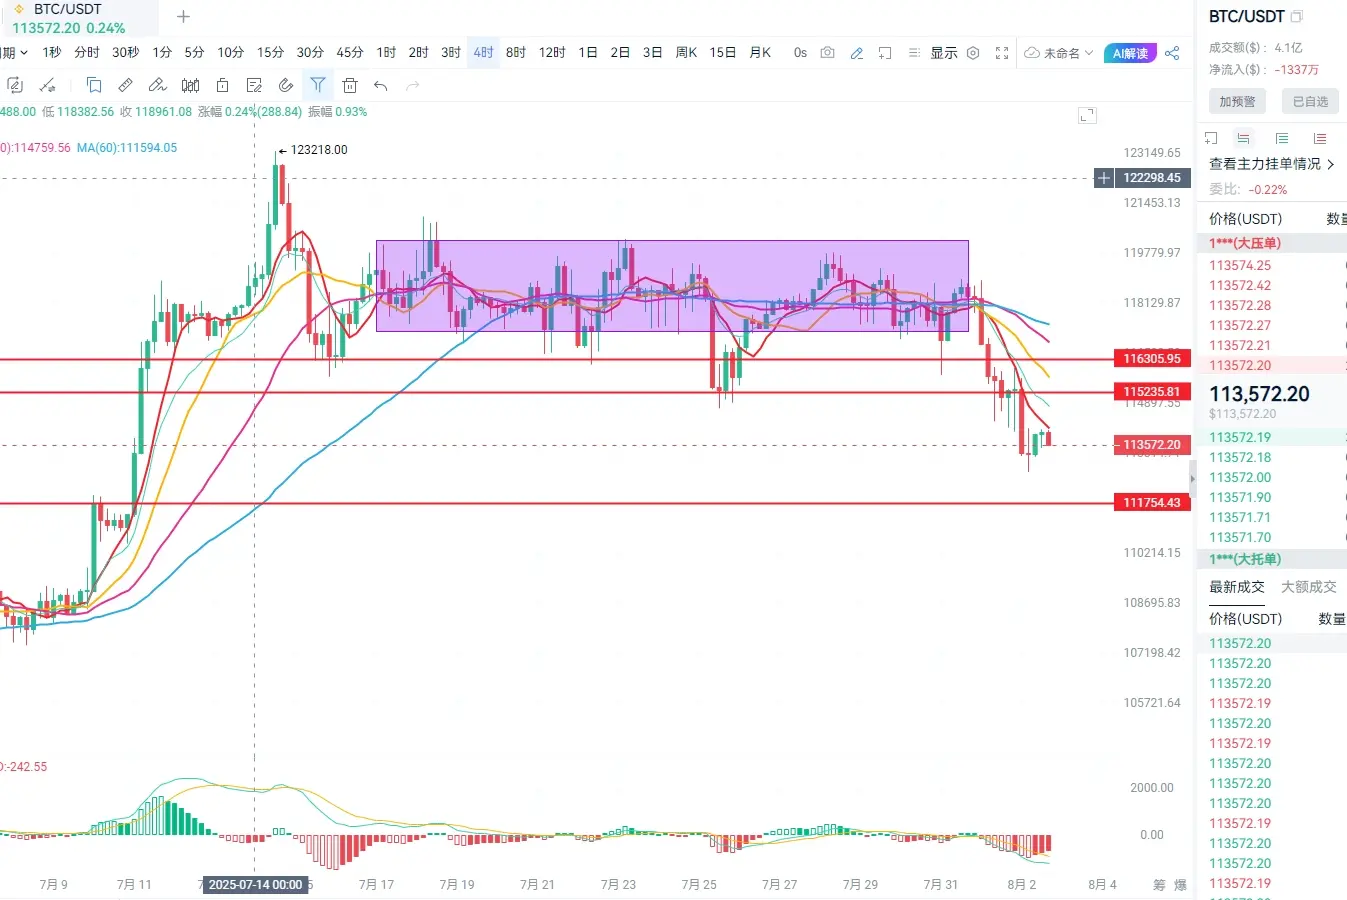
BTC 4-hour cycle K-line interpretation!!
Core View Summary: The current market BTC is in a 【downtrend】.
Technical core drivers: The three black crows pattern is significant, with moving averages in a bearish arrangement and a death cross forming a bearish resonance, both trend and momentum indicate a downward direction.
External environmental impact: The overall external environment is neutral, and market sentiment has not provided a clear direction, with mixed news.
Main potential risk: The current price is close to the strong support level of 111754.43, which may limit further price declines
BTC1.92%
- Reward
- 2
- 1
- Share
GateUser-f9eece58 :
:
Just go for it💪Core Summary of Key Points
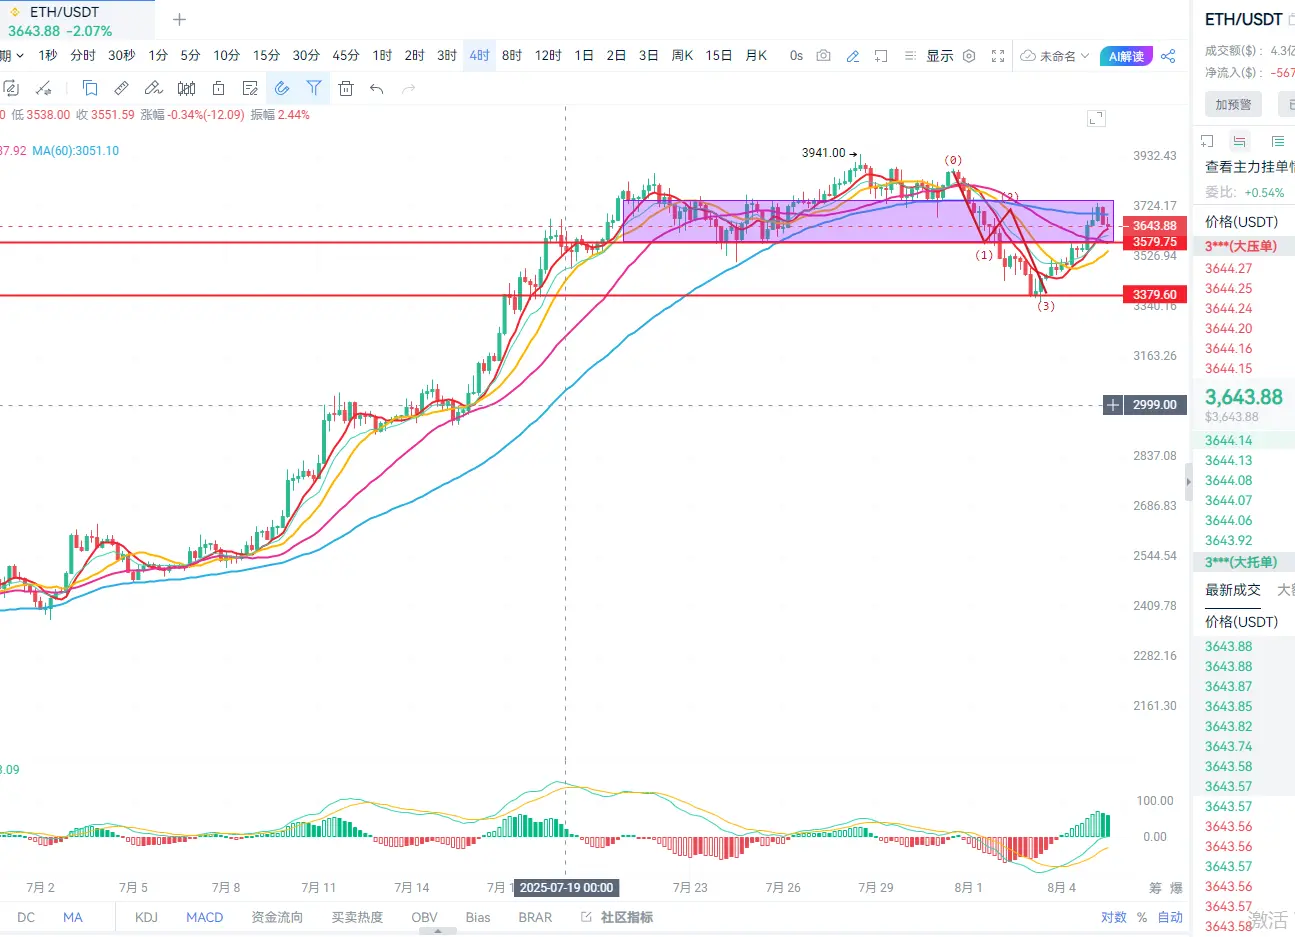
The current market ETH is in a 【downward trend】.
Technical core drivers: Extremely low trading volume and price below VWAP create a volume-price divergence, indicating insufficient market momentum.
External Environment Impact: Market sentiment is neutral, there is no significant pressure in the macro environment, and the news is mixed.
Main potential risks: BOLL and RSI indicators show a balanced market sentiment, normal volatility, which may limit the downside potential.
I. Overall Analysis and Judgment
ETH/USDT shows a clear downtrend on the 4-hour chart, with a ke
View OriginalThe current market ETH is in a 【downward trend】.
Technical core drivers: Extremely low trading volume and price below VWAP create a volume-price divergence, indicating insufficient market momentum.
External Environment Impact: Market sentiment is neutral, there is no significant pressure in the macro environment, and the news is mixed.
Main potential risks: BOLL and RSI indicators show a balanced market sentiment, normal volatility, which may limit the downside potential.
I. Overall Analysis and Judgment
ETH/USDT shows a clear downtrend on the 4-hour chart, with a ke
- Reward
- 1
- Comment
- Share
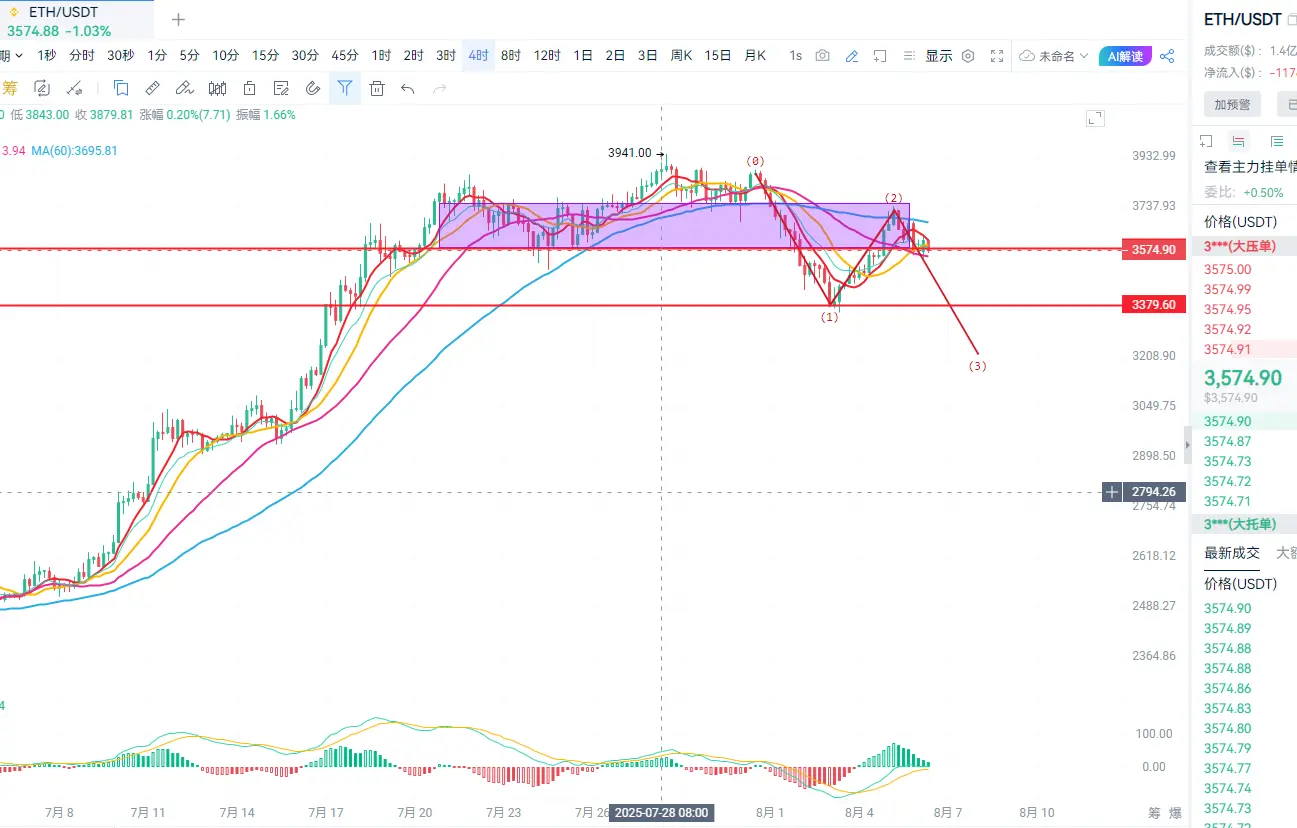
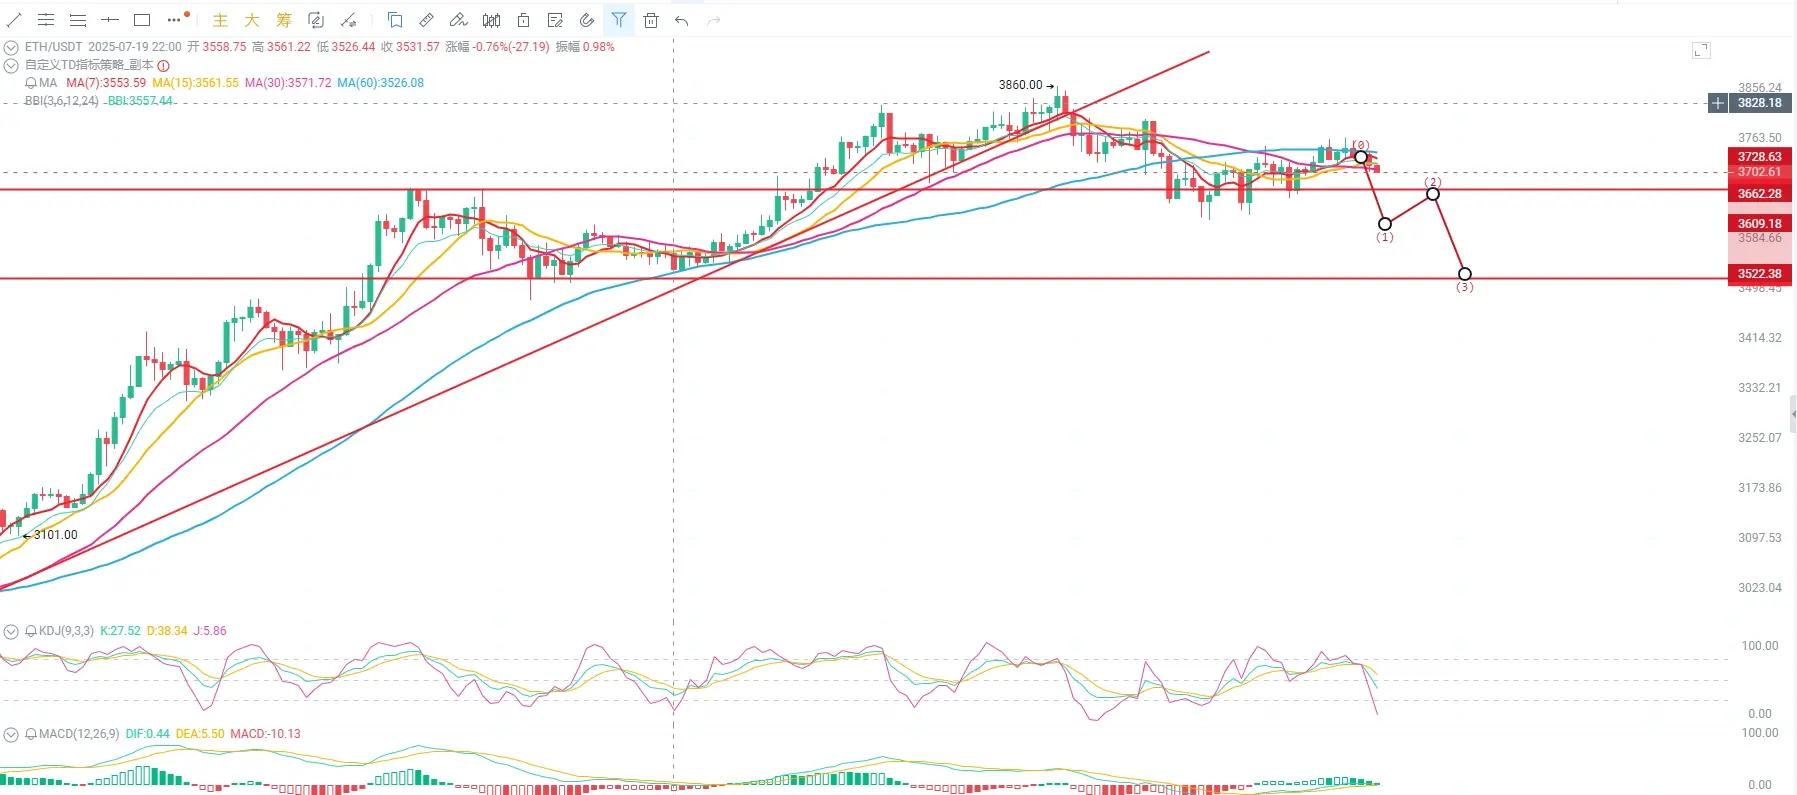
ETH 4-hour candlestick analysis!
Core viewpoint summary: Currently, the market ETH is in a [ambiguous trend].
Technical core drivers: The price has broken through the short-term moving average accompanied by an increase in MACD momentum and a bullish engulfing pattern, indicating signs of a short-term rebound, but the extremely low trading volume limits the sustainability of the rise.
External environmental impact: Market sentiment is neutral, with no significant pressure or benefits in the macro environment, and mixed news.
Main potential risks: Insufficient trading volume leads to a lack of
View OriginalCore viewpoint summary: Currently, the market ETH is in a [ambiguous trend].
Technical core drivers: The price has broken through the short-term moving average accompanied by an increase in MACD momentum and a bullish engulfing pattern, indicating signs of a short-term rebound, but the extremely low trading volume limits the sustainability of the rise.
External environmental impact: Market sentiment is neutral, with no significant pressure or benefits in the macro environment, and mixed news.
Main potential risks: Insufficient trading volume leads to a lack of
- Reward
- like
- 1
- Share
GateUser-725e6ae7 :
:
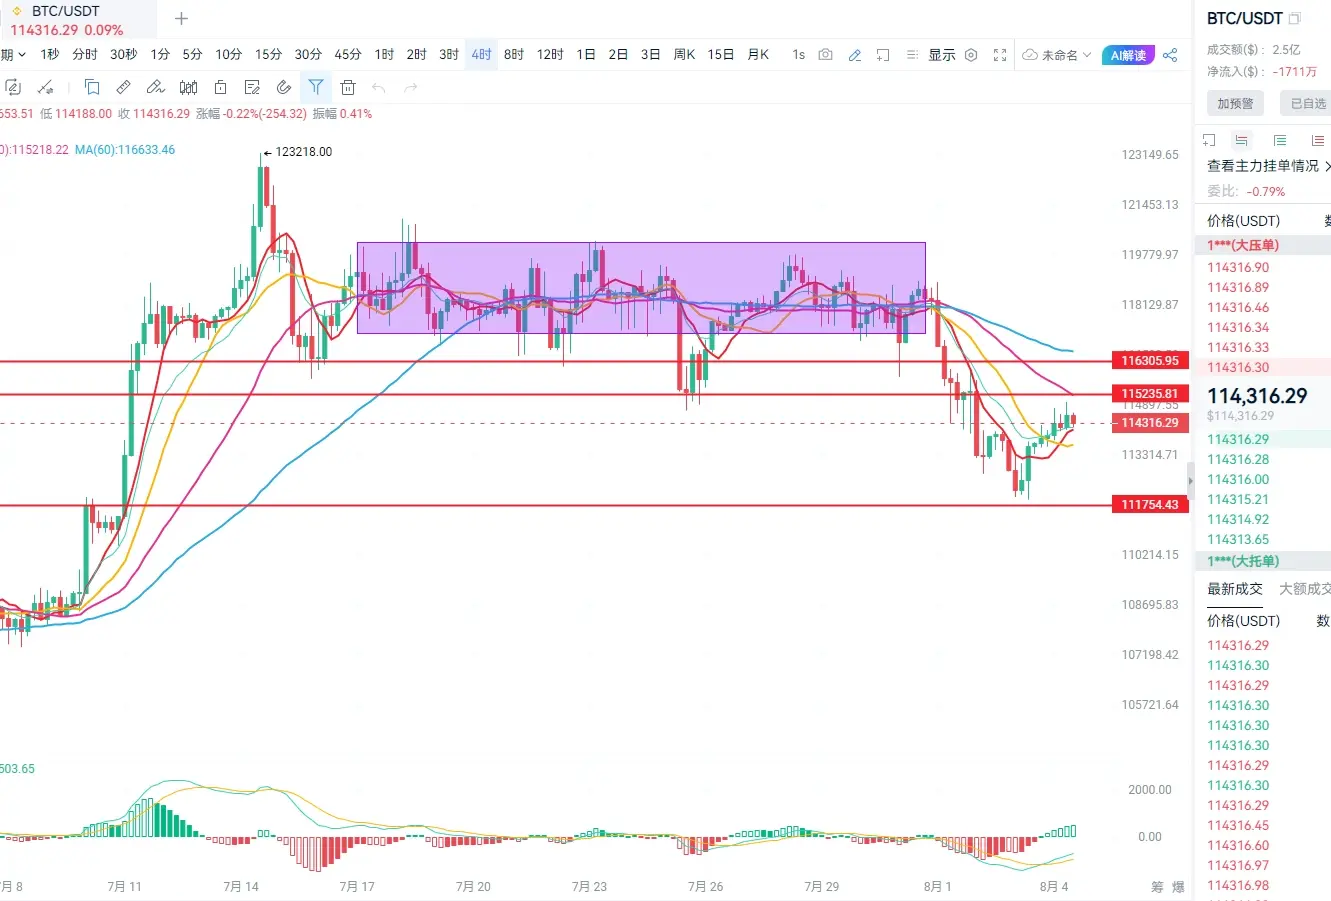
666666BTC 4-hour Candlestick Interpretation
The current market BTC is in a [range oscillation]. Technical core drivers: the price is between key support level and resistance level, with the resistance level forming significant suppression. At the same time, divergence between volume and price and a bearish engulfing pattern suggest pullback risks. * **External environment impact**: Market sentiment is neutral, macro environment pressure is limited, and news is mixed, overall impact is slightly neutral. * **Main potential risks**: Insufficient upward momentum may lead to the price potentially pulling back to the support level.
BTC1.92%
- Reward
- like
- Comment
- Share
ETH 4-hour period Sideways fluctuation
ETH is in a sideways fluctuation on the 4-hour chart, with a fluctuation range of 3400-3600.
ETH2.27%
- Reward
- like
- Comment
- Share
Conclusion: BTC 4-hour cycle, market is in a Sideways fluctuation range 112000-115500. Contract strategy: support long at 112000, target 115000; short near 115500, target 112000.
Analysis: The current market BTC is in a [Sideways] phase. The core technical drivers: extremely low trading volume and price trading within the BOLL band indicate low market volatility and balanced sentiment.
External environment impact: market sentiment is neutral, macro pressure is limited, and news is mixed.
Main potential risk: A failure to break through key price levels may cause the market to fall into a deeper
BTC1.92%
- Reward
- 6
- 4
- Share
LittleSuKa:
123View More
I have always participated in the ALPHA score brushing airdrops and competitions. This ALPHA activity on Gate is a very stable benefit for friends with less capital. A few hundred U can yield good returns. I suggest everyone can participate; the monthly gains are better than your job. #alpha#
View Original
- Reward
- 1
- Comment
- Share
- Reward
- 37
- 19
- Share
TheSuperShort :
:
Just go for it💪View More
The 4-hour ETH trend is bearish.
The 4-hour cycle is about to迎来 swing trading pullback!
- Reward
- 1
- 1
- Share
GateUser-8d760d6f:
1000x Vibes 🤑ETH hourly chart, the trend is oscillating and slightly weak.
Conclusion: ETH hourly period remains in a high-level sideways fluctuation, with a weak trend.
ETH2.27%
- Reward
- like
- Comment
- Share
- Reward
- like
- Comment
- Share
- Reward
- 5
- Comment
- Share
- Reward
- 1
- 14
- Share
HelloSister :
:
Hold on tight, we're taking off To da moon 🛫View More
- Reward
- like
- 2
- Share
ALPHABrotherHai:
TBC trash diskView More

- Reward
- 9
- 6
- Share
GetPreparedToPotentialLongWick :
:
Hurry up and enter a position! 🚗View More
ETH hourly swing trading pullback
Price Trend Analysis
K-line pattern:
The 1-hour chart shows the price oscillating in the range of 3700-3760, with recent multiple tests of the resistance near 3750 followed by a pullback, forming a short-term double top pattern.
The daily chart has shown three consecutive days of long upper shadows, indicating significant selling pressure above 3750, but the lows are gradually rising (3616→3702), forming an ascending wedge.
Technical Indicators:
MACD: 1-hour DIF crossed below DEA (0.93→-0.68), histogram volume decreased, daily MACD high-level death cross (314.
ETH2.27%
- Reward
- 2
- Comment
- Share
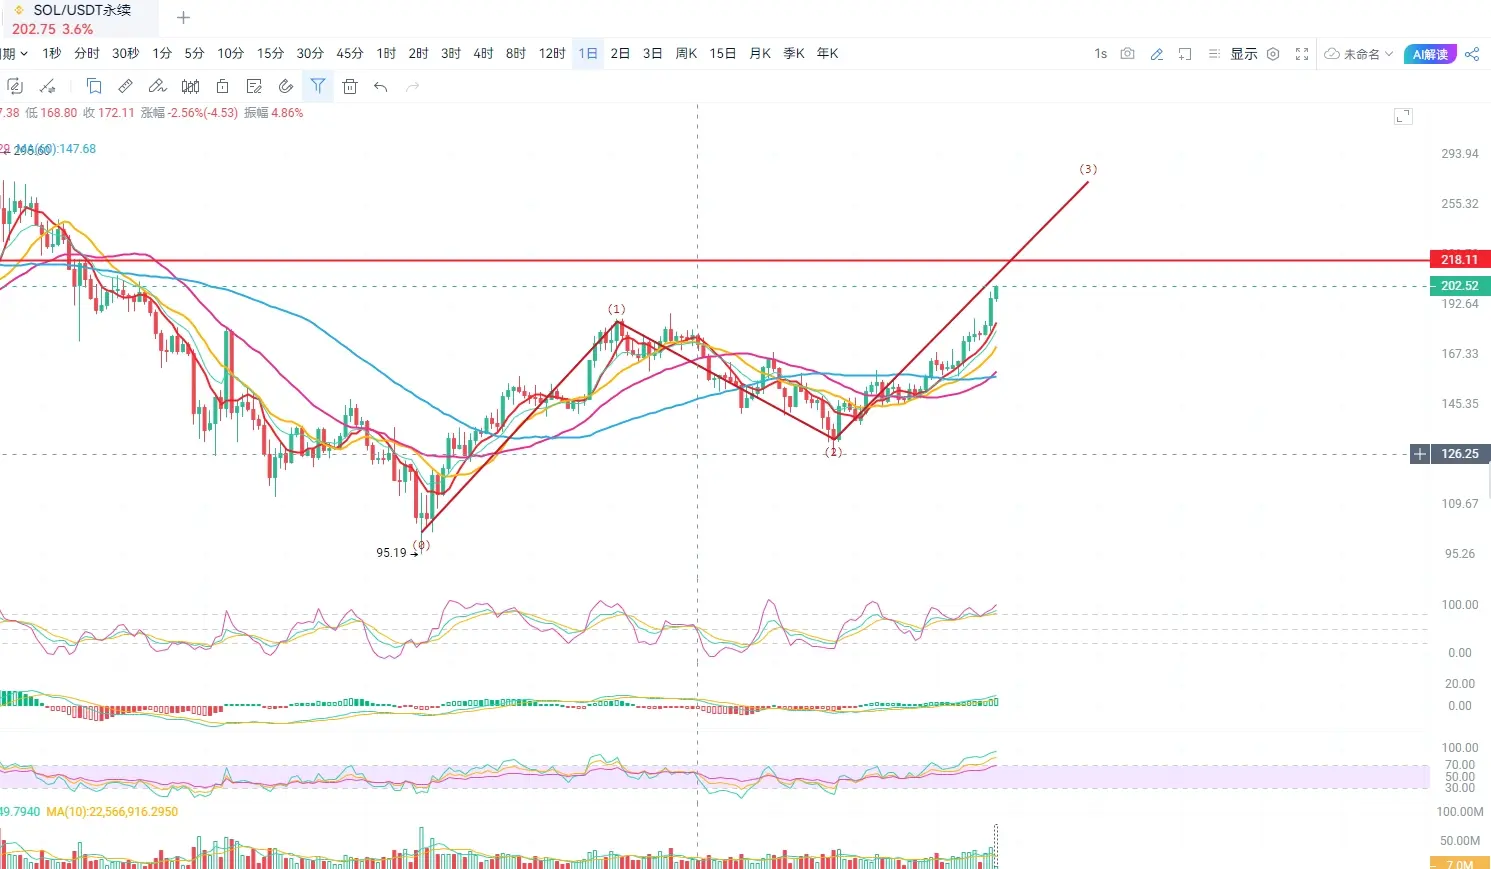
#sol# SOLTo da moon??
K-line pattern:
Recently, there has been a continuous series of bullish candles on the 1-hour chart breaking through the 200 psychological level, with a strong bullish candle at 09:00 (up 4.43%) confirming short-term strength.
The daily chart has formed a three consecutive bullish acceleration structure. After breaking the previous high of 199.28 on the 21st, it reached a new high of 203.02, indicating a typical upward channel.
Technical Indicators:
MACD: 1 hour level DIF ( 3.86) crosses above DEA ( 3.47) forming a golden cross, daily MACD histogram ( 7.87) continues to ex
SOL2.91%
- Reward
- 5
- 3
- Share
AQuarterPastTwo:
Quick, enter a position! 🚗View More

- Reward
- 2
- 1
- Share
GateUser-d2623868:
Ape In 🚀