

GoldMinerRich
5 years of trading experience, friends from all over the world, knowing each other means being fren, seek victory steadily, without taking risks there is no chance to turn things around.
GoldMinerRich
It's been a day and a night, what should we do brothers???
View Original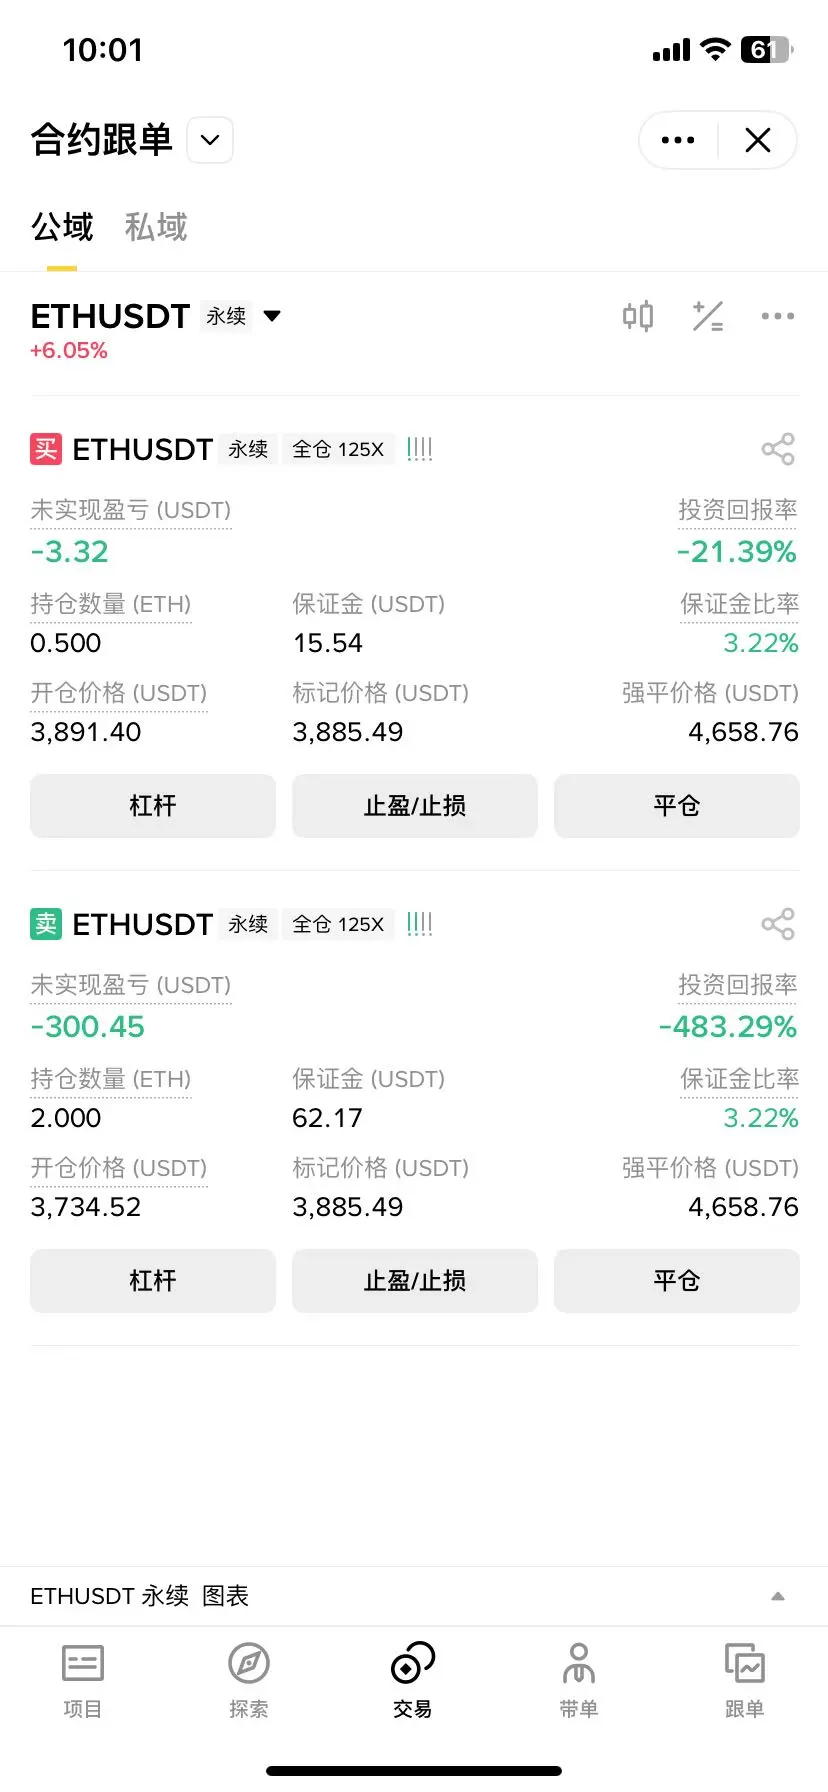
- Reward
- like
- Comment
- Repost
- Share
ETH Attention, today the daily chart tests the upper Bollinger Band middle band line. Holding above 3700 will lead to an upward movement, with the upper pressure point at 3830, strong resistance at 4000. Pay attention to fluctuations, with support below at 3630; 3503.
ETH4.32%
- Reward
- like
- Comment
- Repost
- Share
- Reward
- like
- 1
- Repost
- Share
ThePlayfulCarrotMonkey :
:
Not bad, today I made 7.8 USDT, very satisfying, haha.- Reward
- like
- Comment
- Repost
- Share
This myx still can't be played.
View Original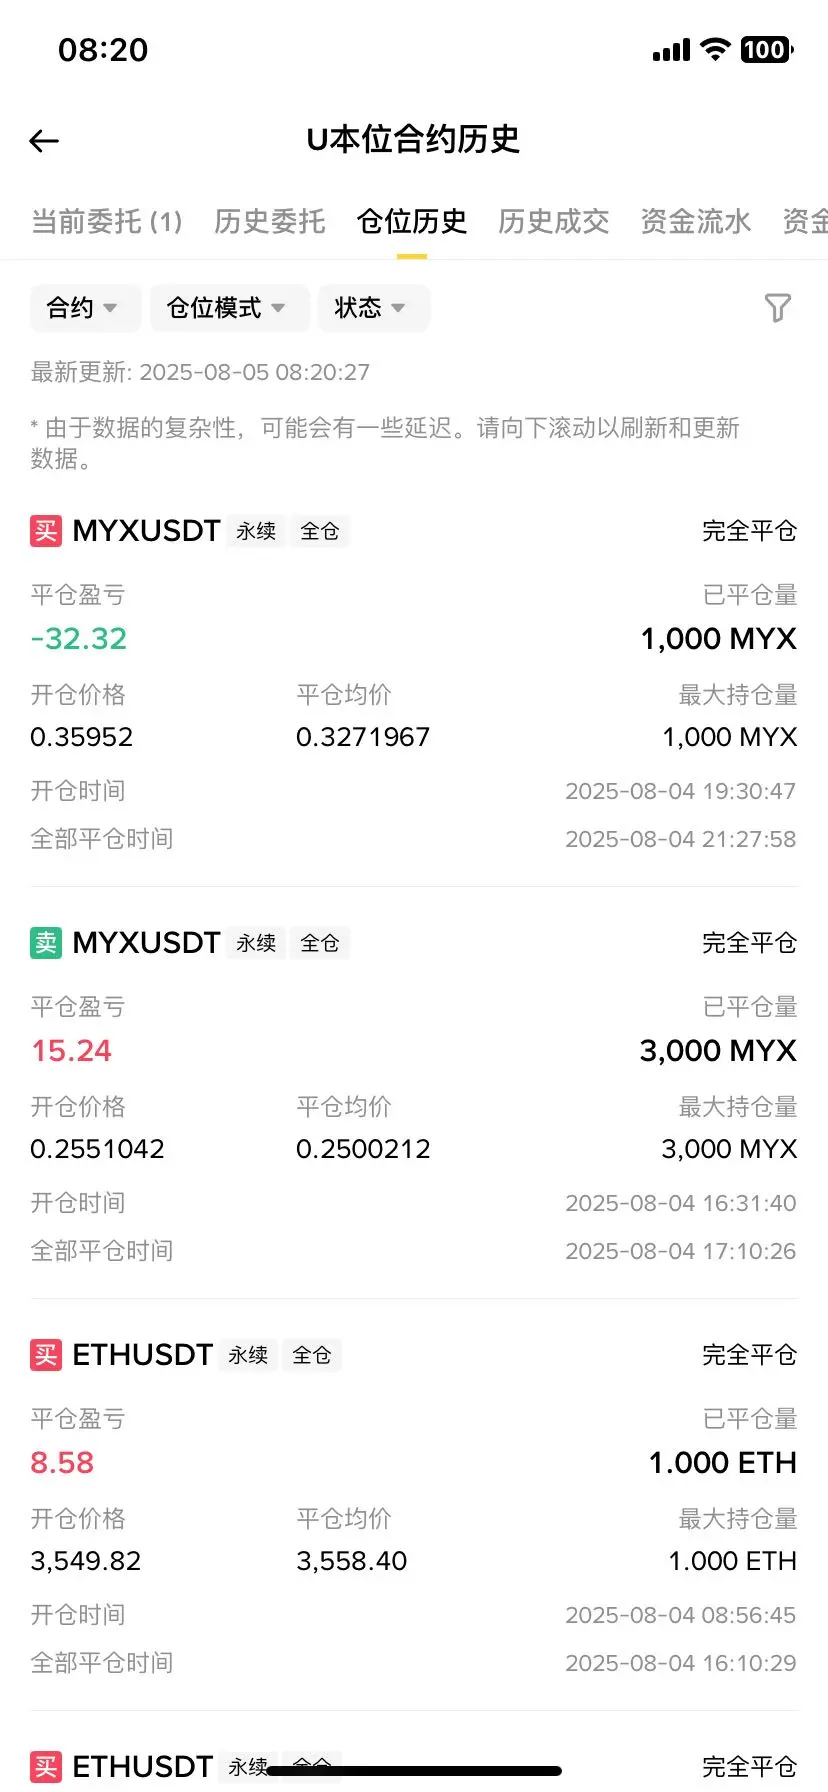
- Reward
- like
- Comment
- Repost
- Share
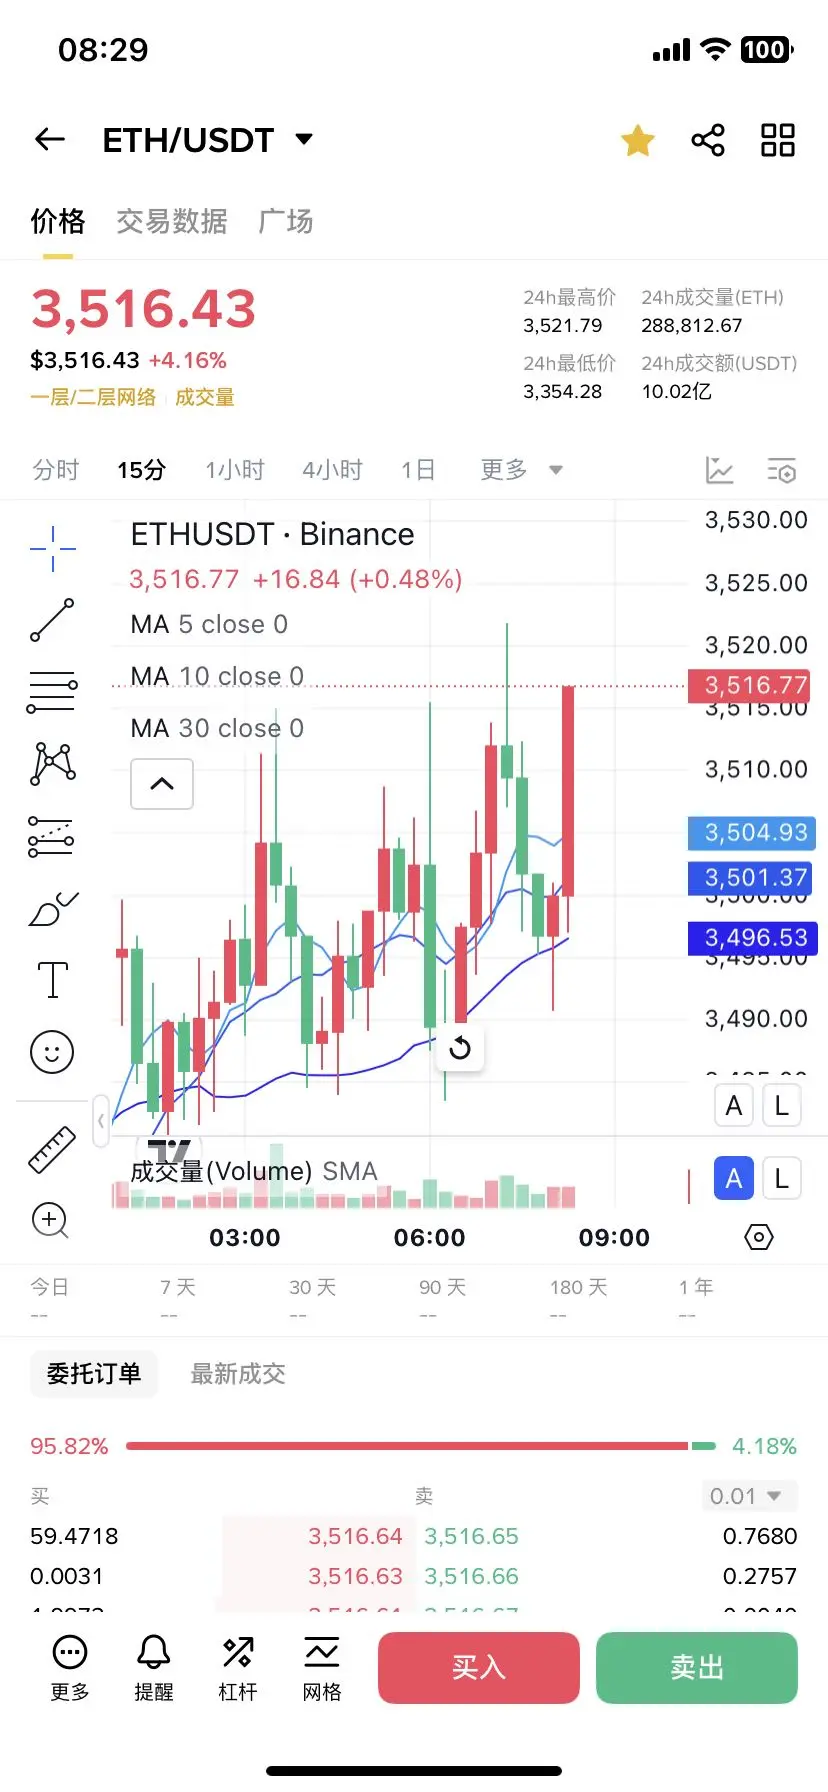
Market Analysis on August 4, 2025
First, let's take a look at the Ethereum 1-hour candlestick chart.
Bollinger Bands Indicator:
The Bollinger Bands are opening and closing with horizontal upper and lower lines, corresponding to prices 3516———3443. The middle band of the Bollinger Bands is moving upwards, corresponding to a price of 3480. Ethereum is positioned above the middle band, with a high-level consolidation range oscillating, and the oscillation consolidation range is 3520~3460.
Ma Moving Average Indicator:
The MA moving average indicator shows that the 5-day moving average and the 10-d
View OriginalFirst, let's take a look at the Ethereum 1-hour candlestick chart.
Bollinger Bands Indicator:
The Bollinger Bands are opening and closing with horizontal upper and lower lines, corresponding to prices 3516———3443. The middle band of the Bollinger Bands is moving upwards, corresponding to a price of 3480. Ethereum is positioned above the middle band, with a high-level consolidation range oscillating, and the oscillation consolidation range is 3520~3460.
Ma Moving Average Indicator:
The MA moving average indicator shows that the 5-day moving average and the 10-d
- Reward
- like
- Comment
- Repost
- Share
Have you ever wondered why some teams can forge ahead through difficulties while others just linger in place? Our team is the pioneer that breaks through the fog!
View Original
- Reward
- like
- Comment
- Repost
- Share
Take it slow!!!
View Original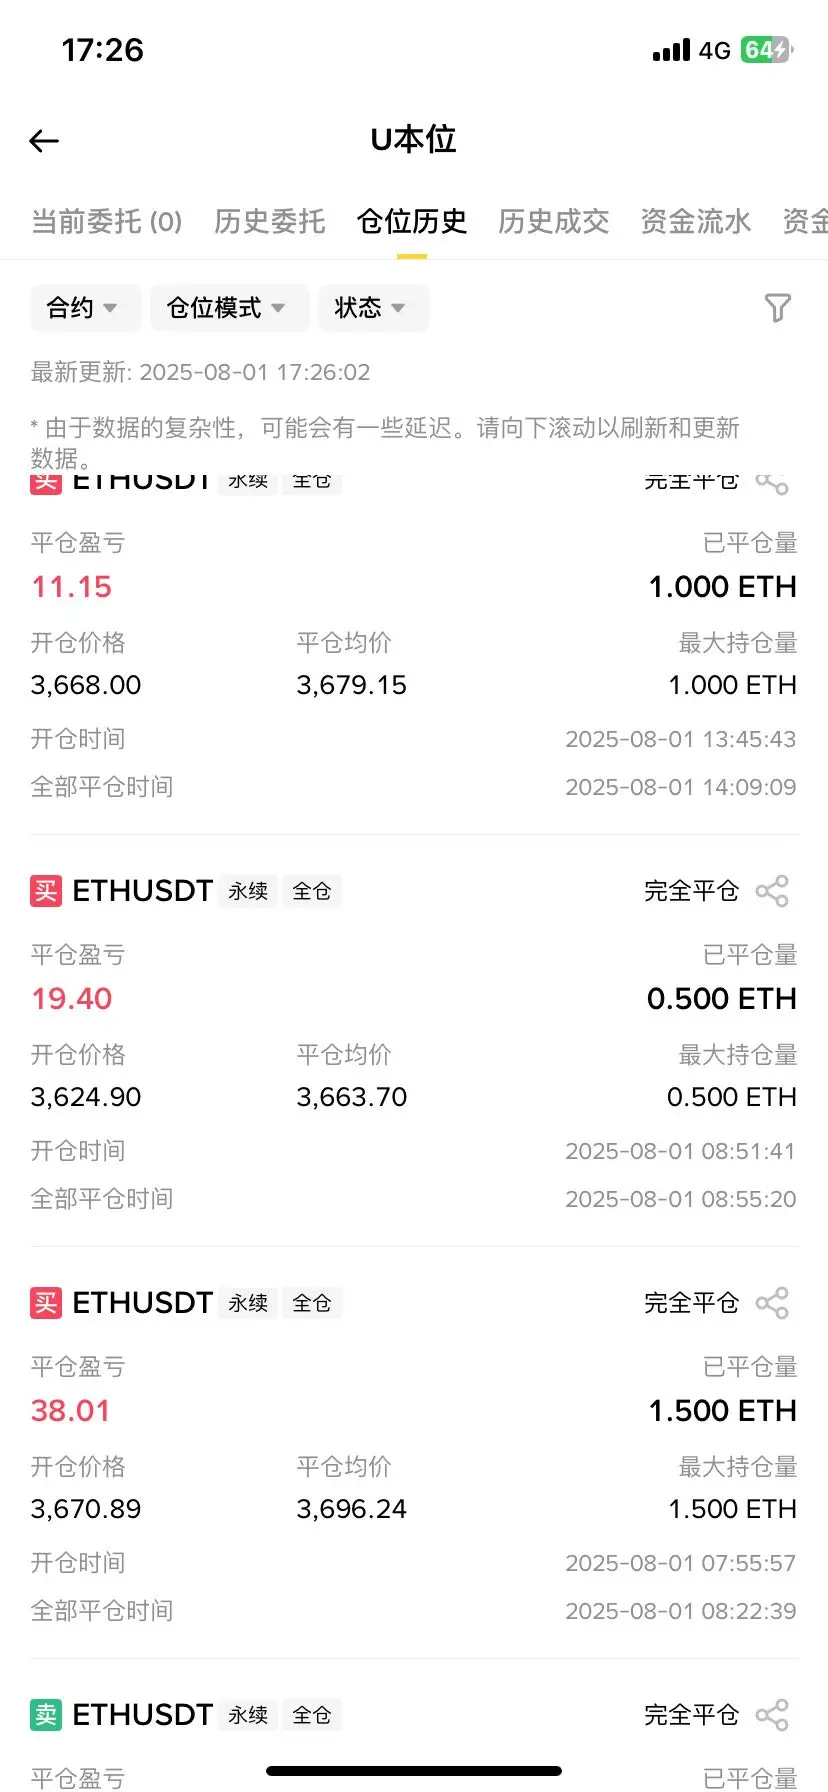
- Reward
- like
- Comment
- Repost
- Share
Brothers, how far can it fall??
View Original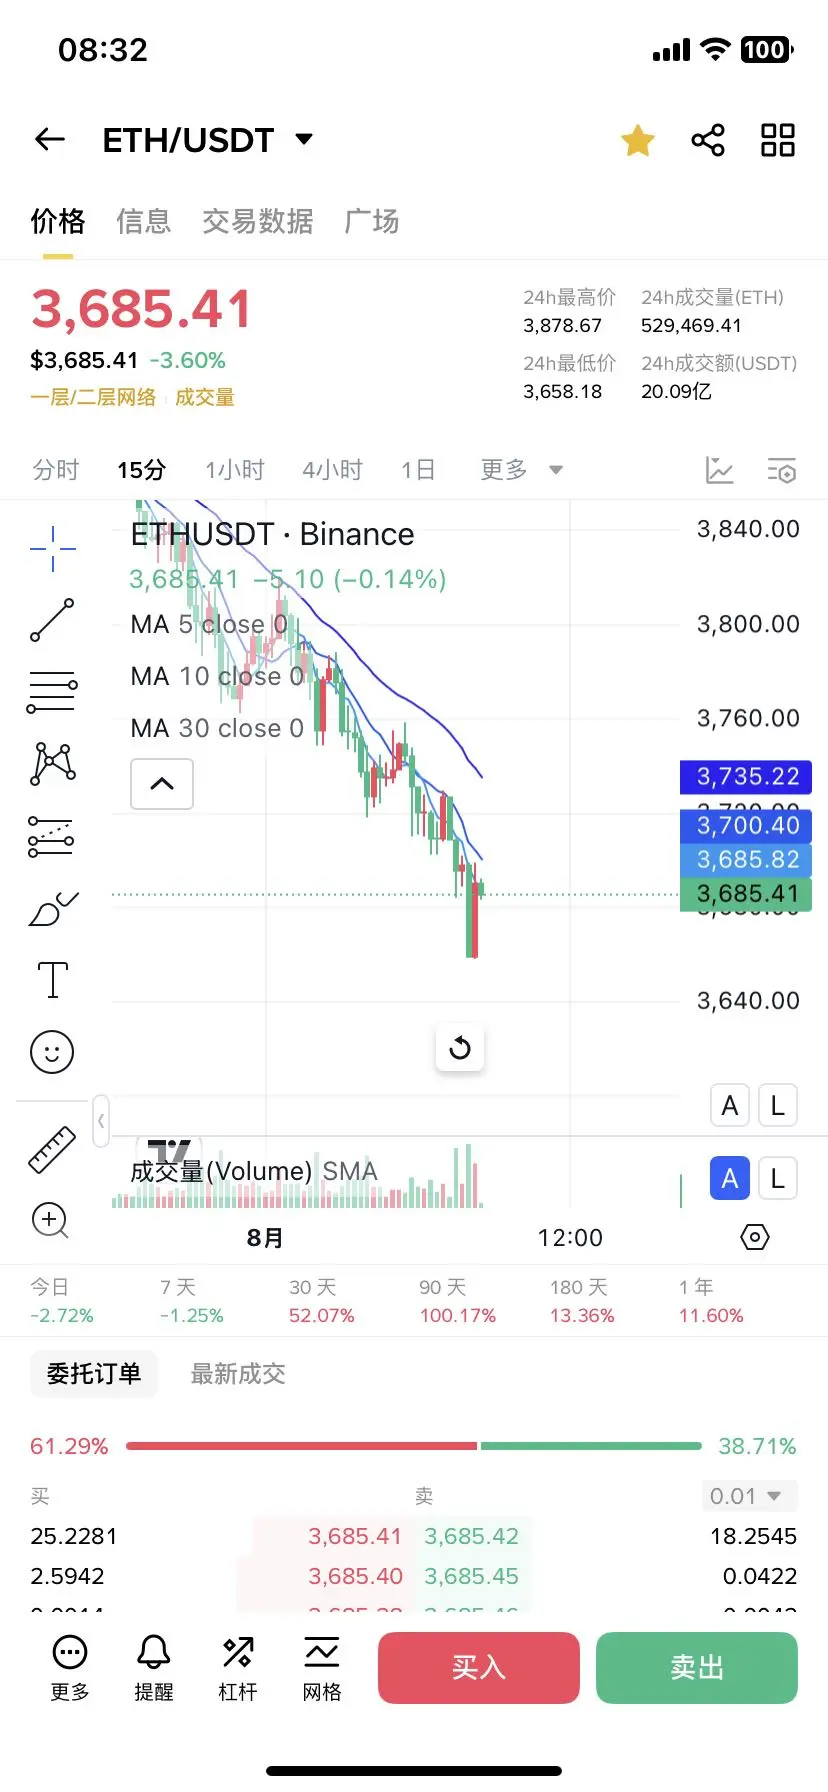
- Reward
- like
- Comment
- Repost
- Share
Brothers, can we multiply it by 5 in a week!!!!
View Original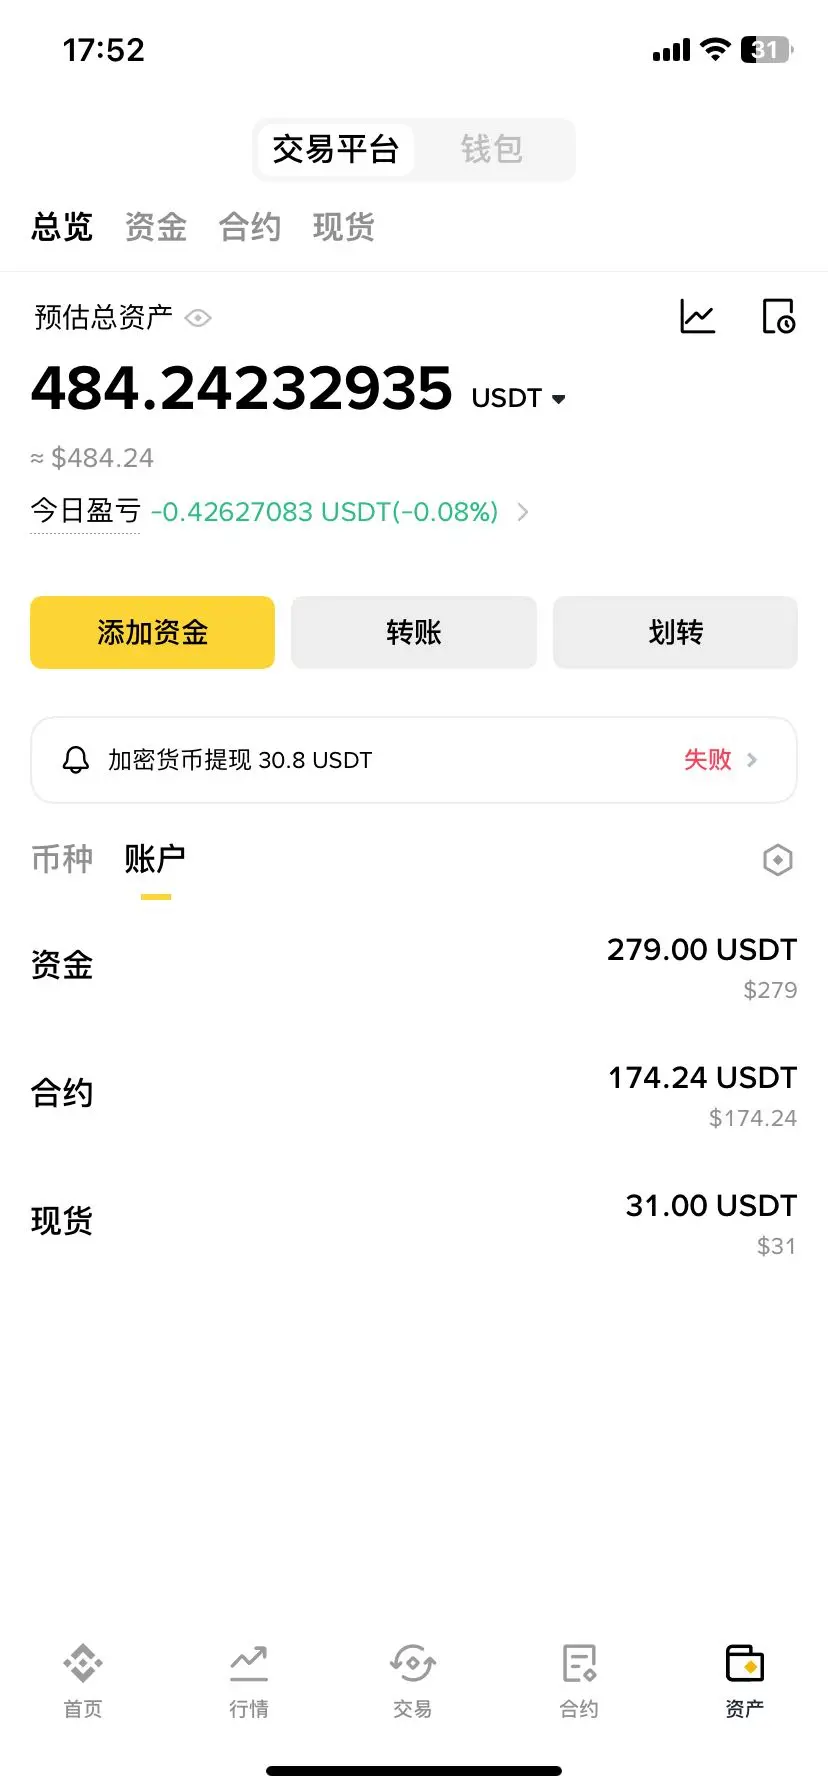
- Reward
- like
- Comment
- Repost
- Share
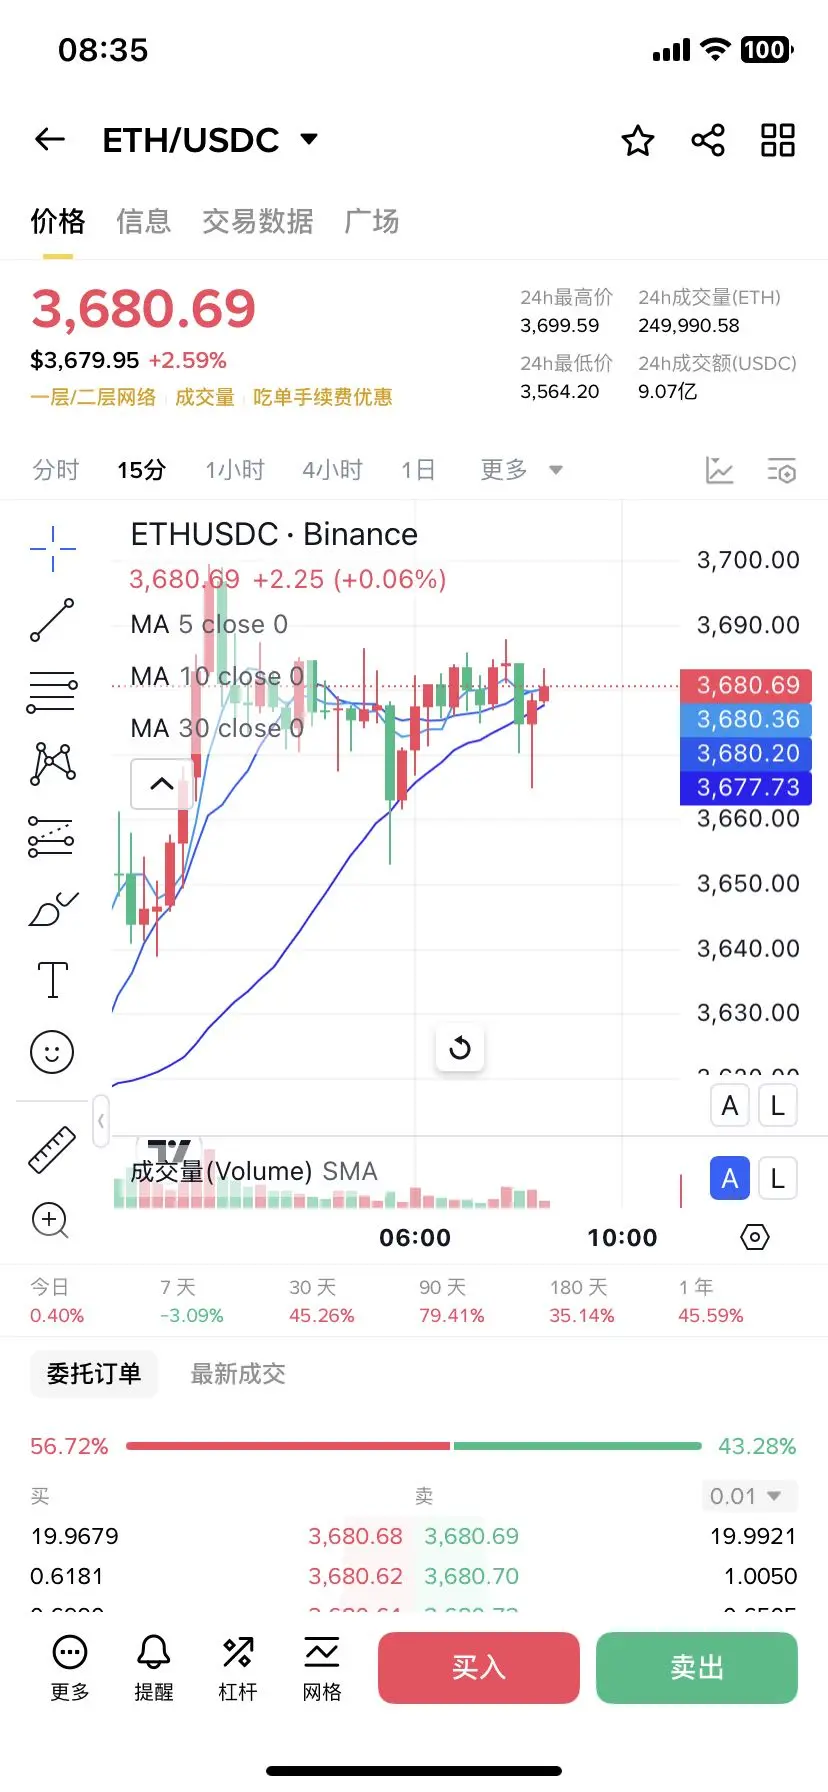
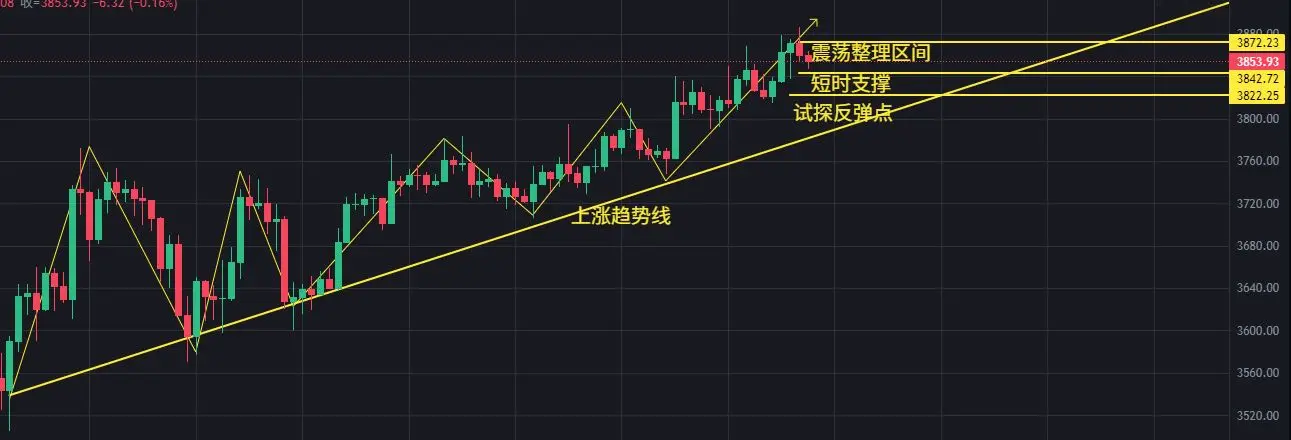
eth market this morning
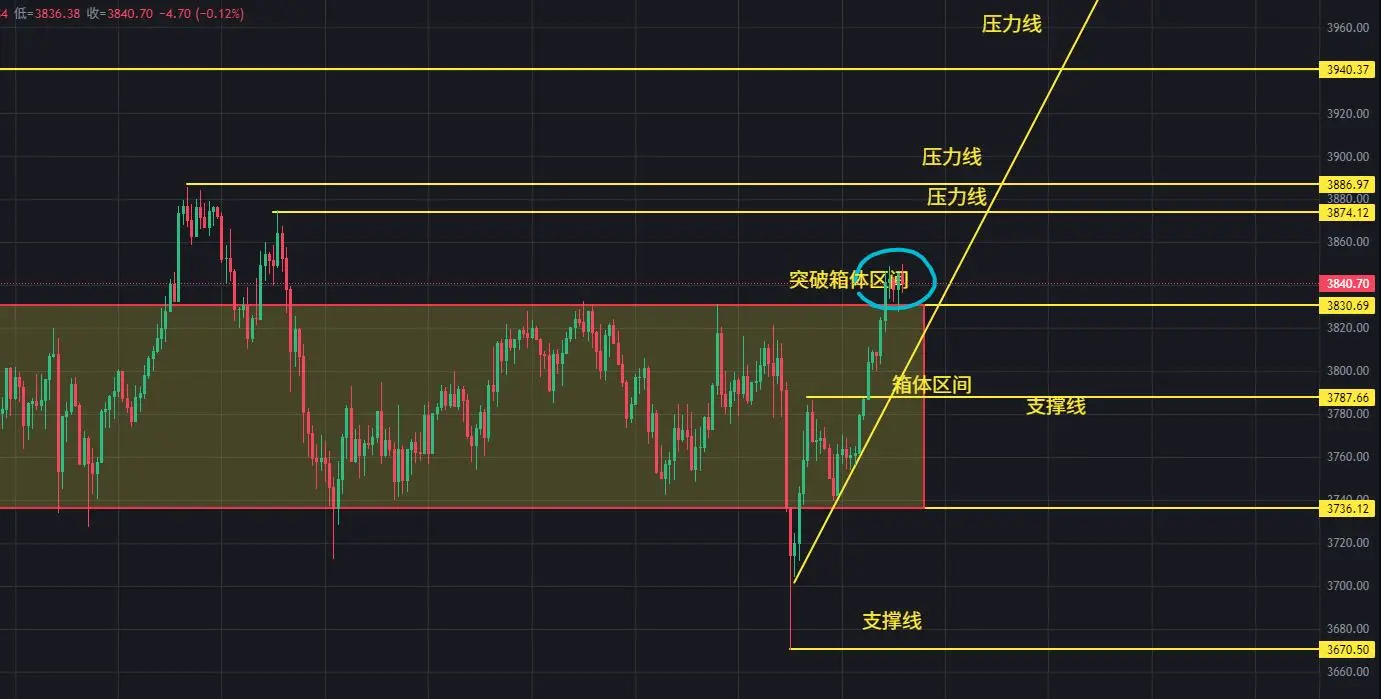
Conclusion: Direction: Oscillating upward, entering a consolidation phase after a high surge.
Resistance level above: 3886, strong resistance level: 3950
Support level below: 3790, strong support level: 3666
Current trend: High-level volatility, with another round of slight upward movement (not large in amplitude) to stabilize at 3840 and test 3888, followed by a slight pullback. If it does not stabilize at 3840, it will fluctuate in the range of 3794--3850.
ETH4.32%
- Reward
- like
- Comment
- Repost
- Share
How will Ether move? What will happen next? Who can tell me???!?!?#Ethereum ETF
ETH4.32%
- Reward
- like
- Comment
- Repost
- Share
July 28, 2025
ETH Analysis
First, look at the technical analysis.
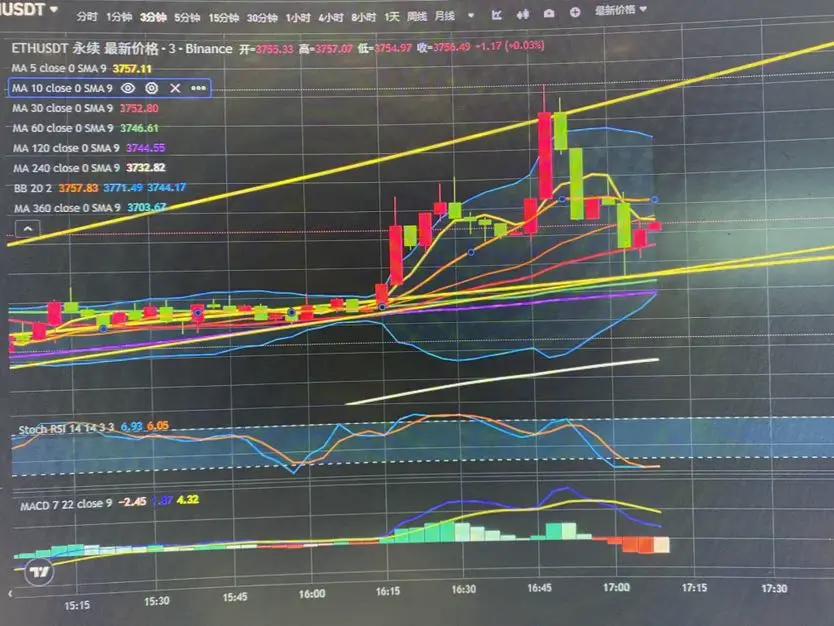
First, let's look at the 1-hour Bollinger Bands. The Bollinger Bands for Ethereum on the 1-hour chart show an upward trend. The upward trend corresponds to the range of 3882---3756. The current candlestick pattern shows a one-sided upward trend, positioned above the middle line of the Bollinger Bands, with the middle line corresponding to a price of 3819.
The K-line breaks through the upper Bollinger Band, slightly dips back, falls back down, currently testing the 10-day moving average, corresponding to a price of 3842, breaks b
View OriginalETH Analysis
First, look at the technical analysis.
First, let's look at the 1-hour Bollinger Bands. The Bollinger Bands for Ethereum on the 1-hour chart show an upward trend. The upward trend corresponds to the range of 3882---3756. The current candlestick pattern shows a one-sided upward trend, positioned above the middle line of the Bollinger Bands, with the middle line corresponding to a price of 3819.
The K-line breaks through the upper Bollinger Band, slightly dips back, falls back down, currently testing the 10-day moving average, corresponding to a price of 3842, breaks b
- Reward
- like
- Comment
- Repost
- Share
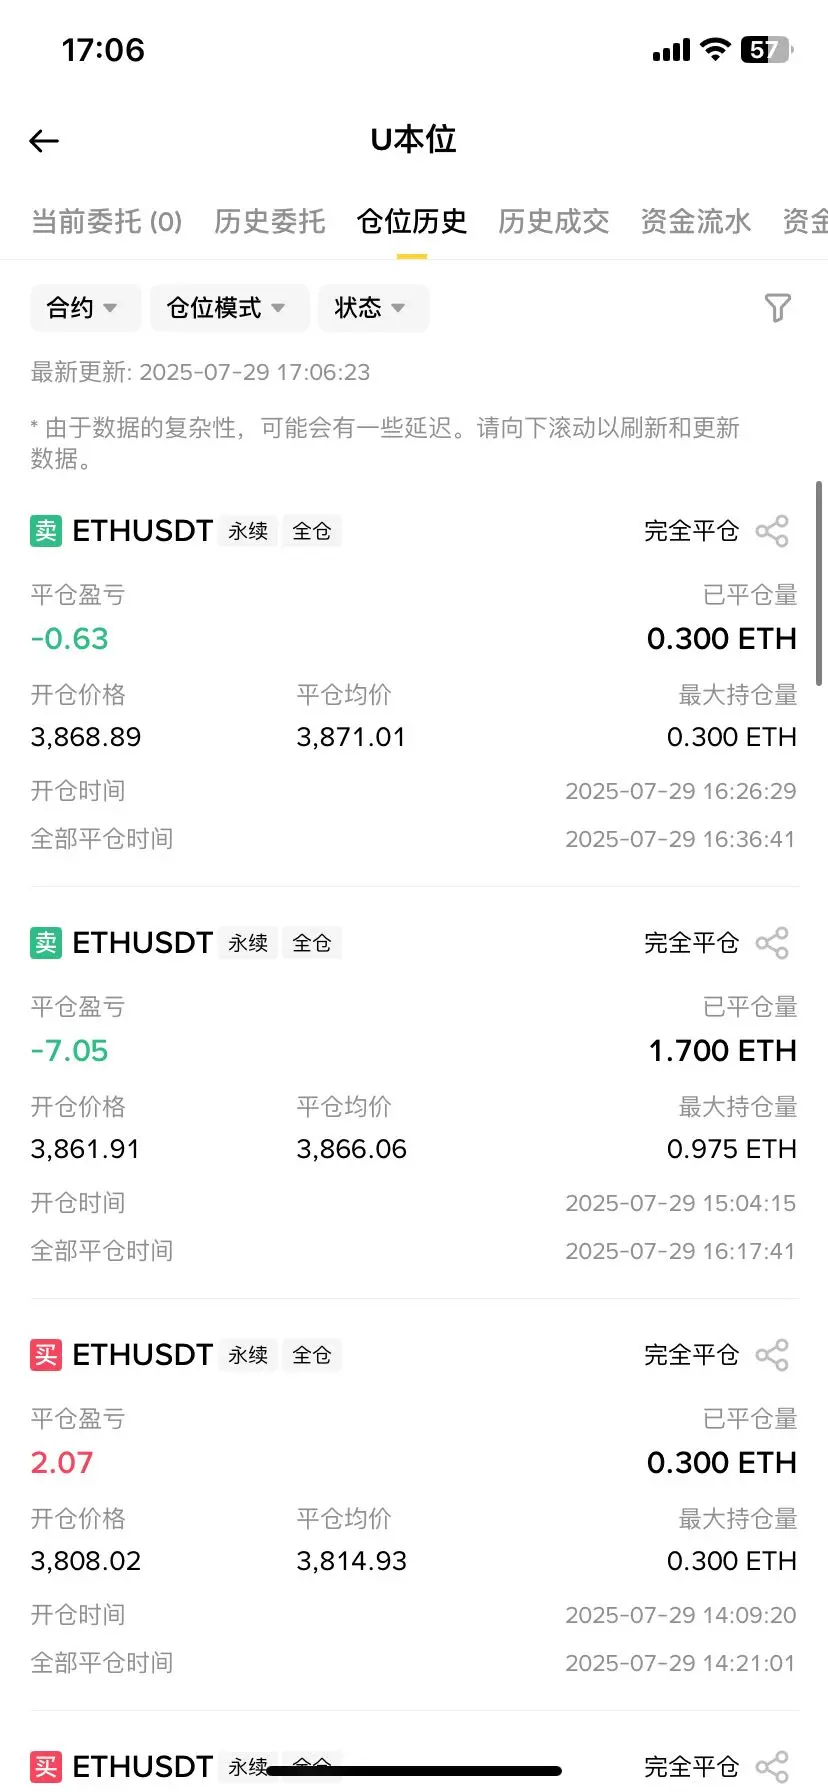
Continuous profit
View Original
- Reward
- like
- Comment
- Repost
- Share
7.27BTC market analysis, the upward structure is still good, the performance in the past period has been relatively weak in the fall, the pullback gives us the opportunity to enter a position with long orders, rebound near 118500 for short, Margin Replenishment near 119200, do a short-term trade with long orders near 117000, the main position is still waiting near 116000.
View Original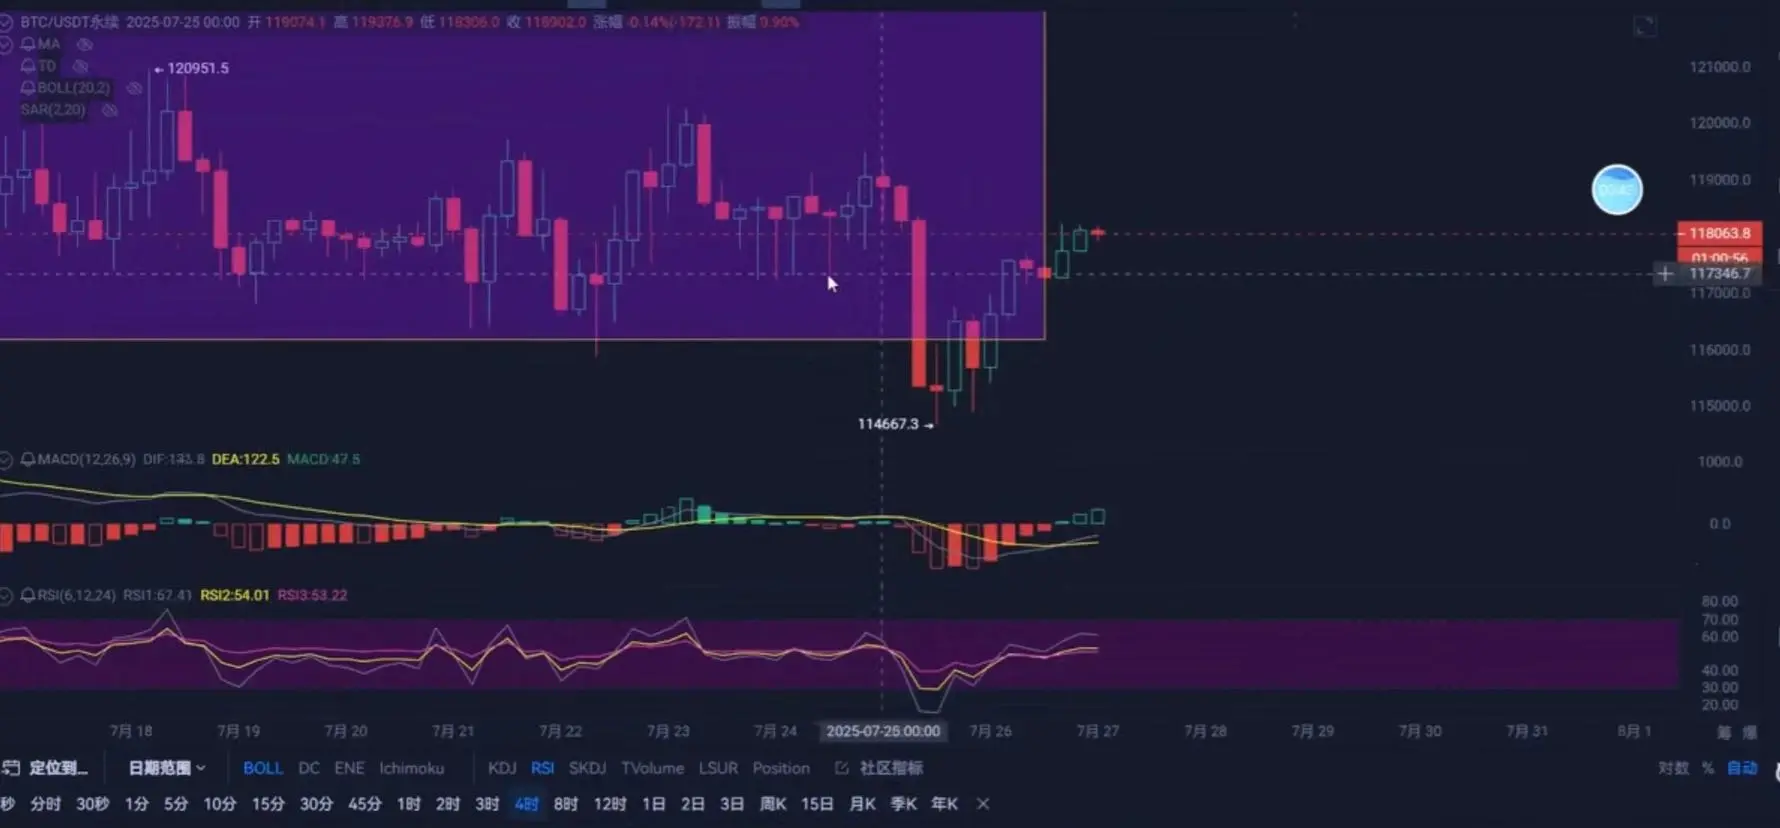
- Reward
- like
- Comment
- Repost
- Share
Execution is more important than prediction. (Breaking the superstition of prediction)
"Record every transaction, the market will give you the answer." (Emphasizing the value of reviewing trades)
"Rules are armor, emotions are a weakness." (Comparing protection and vulnerability)
"There are no perfect trades, only perfect discipline." (Breaking the obsession with perfection)
"The way to make money is to repeat the right things.
View Original"Record every transaction, the market will give you the answer." (Emphasizing the value of reviewing trades)
"Rules are armor, emotions are a weakness." (Comparing protection and vulnerability)
"There are no perfect trades, only perfect discipline." (Breaking the obsession with perfection)
"The way to make money is to repeat the right things.
- Reward
- like
- Comment
- Repost
- Share